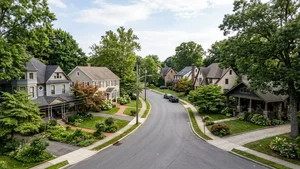
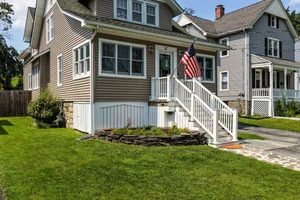
The Town and Village of Warwick, NY, sits at an elevation of about 538 feet - high enough to give it a genuinely distinct four-season climate within the Hudson Valley. Some parts of town reach up to 751 feet, and nearby weather stations measure at 614 feet, so anyone living in Warwick, NY will notice slight variations in temperature and snowfall depending on exactly where a property sits.
Buyers ask me about winters here more than almost anything else. The median home price in Warwick is currently around $493,000, and available inventory moves fast - roughly 17 days on the market. The local weather shapes your utility costs, your maintenance calendar, and what you need an inspector to look at closely. The climate dictates everything from the type of driveway you can realistically manage to the best time of year to schedule a roof replacement.
Warwick Climate Zones and Averages
The mean annual temperature here is about 50.4°F. That number sounds moderate until you realize it's the average of a January that regularly drops below freezing and a July that pushes into the low 70s - Warwick runs the full range of a true humid continental climate.
Climatologists most commonly classify the town as a Dfa zone, meaning a humid continental climate with hot summers. Some sources, like plantmaps.com, label it Dfb instead, pointing to milder summers and wet conditions year-round. Either way, you're getting four real seasons. Total annual precipitation runs about 47.8 inches, spread across all twelve months - there's no dry season to speak of here. You'll want functioning heating and cooling systems, full stop.
Humidity and Rain Cycles
Relative humidity swings with the seasons. It bottoms out in April at around 63% and peaks in November at roughly 72%.
July is the wettest month, contributing to the 5.4 inches the town averages during its rainiest stretches. August and October follow close behind, with about 12 rainy days per month during that window. January, March, and November are the driest months of the year, with precipitation dropping to an average of 3.3 inches.
Season-by-Season Conditions in Orange County
January is the coldest month - average overall temperature of 26.5°F, with daily highs around 33.3°F and overnight lows dropping to about 20.5°F. The bulk of the genuinely hard weather runs December through March, and that four-month stretch is when the heating system earns its keep.
Spring and fall are what a lot of people move here for. May averages a high of 68.5°F and a low of 48.9°F - the kind of weather that makes the Hudson Valley look its best.
Summer Temperatures and Rainfall
July is the warmest month, averaging about 73.3°F overall. June runs close behind, with an average high of 76.6°F and a low of 55.9°F.
Summer also brings the most rain - about 12 days of precipitation per month through July and August. If you're looking at a property during that window, pay attention to drainage and basement moisture. September cools things down noticeably, with daytime highs averaging around 73°F and overnight lows around 52°F.
Precipitation and Annual Snowfall
Warwick's 47.8 inches of total annual precipitation - roughly 1,200 to 1,213 millimeters - comes as a steady mix of rain and snow throughout the year. That consistency is part of what supports local agriculture, including the nearby Black Dirt region.
Snow is a fact of life here. You'll want appropriate tires for commuting and reliable equipment for your driveway. The wet summer months mean active gutter clearing; the colder months shift the focus entirely to snow removal and ice management. Different seasons, different maintenance - plan for both.
How Much Snow to Expect
Warwick averages roughly 38 to 39 inches of snowfall per year. Properties in the 10990 zip code specifically point to 39 inches annually. Most of that accumulation is front-loaded - roughly 31 inches typically fall between December and March.
Storms and Weather Hazards
Orange County sees occasional severe thunderstorms and flash flooding, and if you're looking at anything near a lake or stream, checking local flood maps isn't optional - it's the first thing you should do.
Tornadoes are rare but not unheard of. The National Weather Service periodically issues severe thunderstorm and tornado watches for the county. The most significant event in the historical record is the 1989 Coldenham tornado - an F1 storm, or possible downburst, that struck an elementary school in the county, killed nine people, and remains the deadliest tornado-attributed event in New York State history.
Staying Prepared Year Round
The Orange County government provides tornado-awareness guidance for residents. Confirmed tornado touchdowns stay uncommon, but severe summer thunderstorms happen every single year - that's not a risk you can plan around, but you can plan for it.
Keep the roof maintained. Deal with large trees near the house before a storm makes the decision for you. Power outages come with both heavy summer storms and winter ice events, so that's worth factoring into how you think about a property.
How the Climate Impacts the Local Housing Market
With only about 27 available homes currently in inventory, this is not a market where you have the luxury of waiting out bad weather to take a second look. Properties spend roughly 17 days on the market and often sell slightly above list price.
Homes with climate-controlled storage, efficient HVAC systems, and reliable generators consistently draw more attention from buyers - and honestly, those features matter here in ways they wouldn't in a milder climate. Utility costs during a January cold snap or a humid August are real questions buyers ask, and sellers with efficient systems have a genuine advantage.
Scheduling a move during January, March, or November keeps rain out of the equation, but January also means cold temperatures and the real possibility of snow delays.
Timing Your Move Around the Weather
May and September are the sweet spots - moderate highs in the 68°F to 73°F range, past the worst of the winter and before the heaviest summer humidity and rain set in.
If you close in winter, arrange snow clearing before the moving truck shows up. It's a small thing that becomes a large headache if you skip it.
Frequently Asked Questions
Does the winter weather in Warwick significantly slow down the local housing market?
Yes, the pace typically slows between December and March when the area receives the bulk of its 31 inches of seasonal snow. That said, serious buyers stay active, and well-priced homes still sell quickly.
Are homes in Warwick's Black Dirt region or near Greenwood Lake prone to seasonal flooding?
It depends on the specific property's elevation and proximity to the water. Orange County experiences occasional flash flooding, so you should check local flood maps before purchasing a home in those areas.
How much should new homeowners budget for snow removal and winter heating costs in Warwick?
Costs vary based on the size of the home and driveway. With an average of 38 to 39 inches of snow per year and January lows around 20.5°F, you should budget for regular plowing and consistent heating fuel deliveries.
What are the most common weather-related home repairs buyers should look for during a Warwick home inspection?
Inspectors typically look for roof damage from severe thunderstorms and basement moisture from the 47.8 inches of annual precipitation. You'll also want a close look at the heating system - it works hard during those freezing winter months.
What happens if a major Hudson Valley snowstorm hits during my scheduled home inspection or closing?
Your real estate agent and inspector will typically reschedule for a safer day. With the area averaging 39 inches of snow annually, local professionals are used to adjusting timelines for winter weather.
When is the most reliable time of year to list a house in Warwick to avoid weather-related showing cancellations?
May and September are strong options, with highs around 68.5°F and 73°F respectively. April is also reliable - relative humidity drops to its annual low of 63%, and the threat of heavy snow has passed.